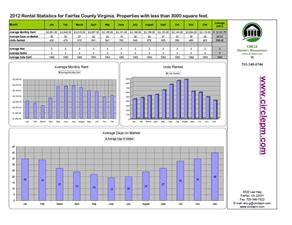
Hot off the press Circle's 2012 market rental report.
We published three year-end charts for the rental Market in Fairfax county. In order to be well informed about market trends we track Days on Market, Average Monthly Rental Prices and Units Rented.
Days on Market is our benchmark for establishing both the market price and an expected time frame for finding your tenant. Seasonal trends are also reflected visually on the chart which helps to understand the seasonality of Real Estate (High and Low periods of demand) The demand is generally lowest in December and highest in May, June, July and August.
Average Monthly Rental Prices establishes the pricing power for owners, when the trend is on the rise it gives us more leeway when pricing a unit to the higher side of the market. This trend line does not have quite the same seasonality as Days on Market and or Units Rented.
Units Rented is our indication of the demand for rental housing. We see seasonal adjustments similar to Days on Market, it's the trend we are always tracking. Demand for rental housing is a key economic indicator which drives our market, we are always watching the direction of consumer demand in the DC area.

About The Author
 Eric Guggenheimer - SFR, ARM ® » Principal Broker, Certified Property Manager, IREM, ARM, NARPM, NVAR, NAR, VAR


