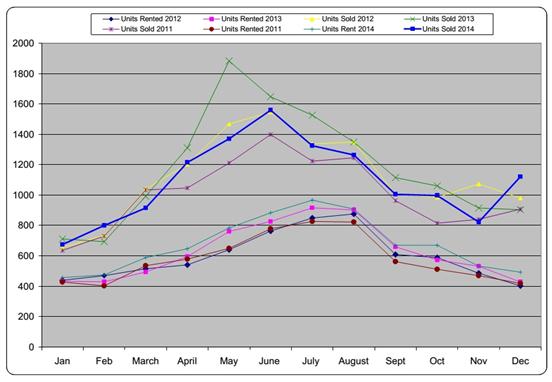
Was 2014 A Good Year?
The answer to the question is, “yes!” When we measure success in the rental market the bellwether statistic is rental income. Rents continue to rise year over year - with Fairfax County’s average rent settling in at $2,212.33 for all of 2014.
That’s an 8% increase from 2011. (Highest average ever in Fairfax)
Average Rents
2011 $2,047
2012 $2,121
2013 $2,201
2014 $2,212
Some of the other data we look at represents more forward-looking information which gives us some insight into the following month. The most revealing statistic is ACTIVE INVENTORY - which provides a snapshot as compared to the previous year. The higher the inventory the longer it will take to rent a property prior to the spring market.
We are able to glean from the active listings and the units rented how many MONTHS SUPPLY of rentals exist.
We use Months Supply, along with Active Inventory in combination with DAYS ON MARKET to establish a possible trend in the following month.
Active Supply of Rentals for December
2013 1148
2014 1334
Units Rented in December
2013 428
2014 492
Months Supply in December
2013 2.66
2014 2.71
Average Days On Market in December
2013 50
2014 50
Housing Sales : How they effect the rental market
One other statistic we look at is the UNITS SOLD number, which provides us with insight to consumer preferences. When we see spikes in Sales we do see a slight dip in demand for Rentals as these consumers are now purchasing rather than renting. But, you can’t always make the leap that the purchasers are choosing not to rent until there is visible evidence in consumer demand shift. In other words, we have to see demand drop below norms for rentals.
In December there was a spike in sales but we also saw a spike in rentals as well. We do not see a dip in demand for 2015 due in part to the nature of Washington, DC and the overall perceptions in the local media that there are not enough rentals to meet demand in the future.
We don’t necessarily agree with this in total and our market is very different based on the property location. The demand is greater inside the beltway, with less demand outside the beltway depending on county, proximity to transportation, and traffic.
Units Sold in December
2011 907
2012 981
2013 904
2014 1122
Summery Statement
It’s always difficult to predict the future. We can only look to the past for reference and then establish an opinion based on our overall feeling of the local economy and conversations with our peers.
Economic Summit with Dr. Stephen Fuller of the George Mason University Center for Regional Analysis
I attended the economic summit with Dr. Stephen Fuller of the GMU Center for Regional Analysis in December. Dr. Fuller was a bit pessimistic regarding the local economy based on several factors. His cautious views are based on the GDP output for our region and the demographic trends as our population ages. His opinion is highly regarded in our region and he is a “go-to guy” for the media on the local economy. It was an insightful forum.
Circle Property Management Charts
December Year End Report
December Year End with Sales
GMU Center for Regional Analysis
Washington Metro Area Gross Regional Product, 2001-2013
http://cra.gmu.edu/pdfs/studies_reports_presentations/GRP_Sep2014.pdf
The U.S. and Washington Area Economic Performance and Outlook
(Washington DC Starts on Page 13)
http://cra.gmu.edu/pdfs/Current_Indicators.pdf
Regional Data Main Page
Message from the Broker Eric Guggenheimer
Our market remains stable in the Washington area and we do not see any headwinds which would lead us into a softer market. Our first quarter is still unpredictable at this time but will depend on weather as to when the spring market will begin. I do feel optimistic for 2015 and look forward to working with all of our clients.
Thank you again and Happy New Year
Eric Guggenheimer, ARM

Note: the larger than usual spike in sales
About The Author
 Eric Guggenheimer - SFR, ARM ® » Principal Broker, Certified Property Manager, IREM, ARM, NARPM, NVAR, NAR, VAR


